
QUICK FACTS
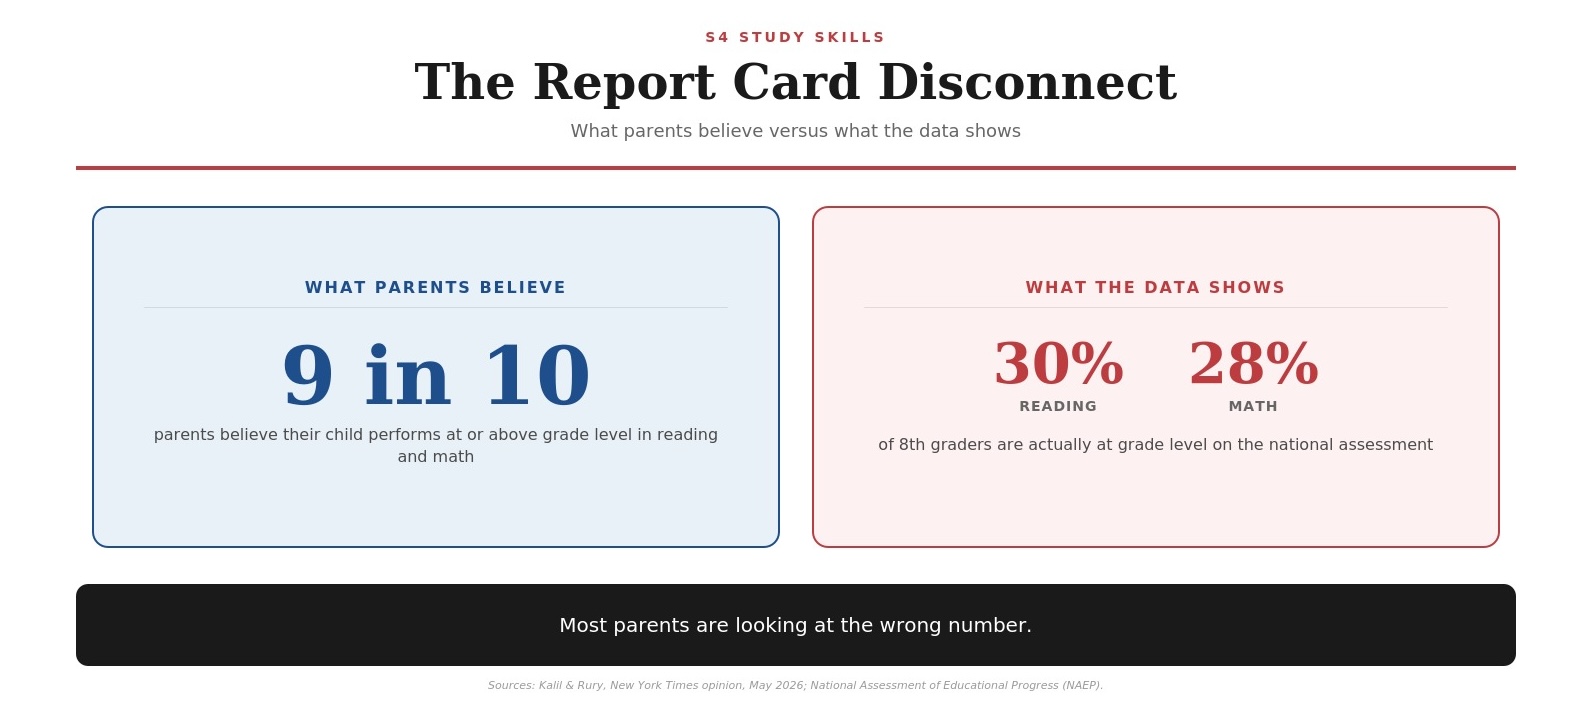
• Nearly 9 in 10 American parents believe their child is performing at or above grade level
• Only 30% of 8th graders are actually at grade level in reading (NAEP)
• Only 28% of 8th graders are actually at grade level in math (NAEP)
• Average high school GPA rose from 3.02 to 3.32 between 2010 and 2022
• More than half of US states have lowered their proficiency standards on state tests
On May 26, the New York Times opinion section ran a piece by two academic researchers under a headline that should make every parent pause.
The piece was written by Ariel Kalil, a professor of public policy at the University of Chicago, and Derek Rury, an assistant professor of economics at Oregon State University. Their title was “It’s Becoming Impossible to Know How Your Kid Is Doing in School.”
Their argument is direct.
Nearly nine in ten American parents believe their child is performing at or above grade level in reading and math. The actual numbers, measured by the National Assessment of Educational Progress, are 30 percent in reading and 28 percent in math among eighth graders.
That gap reflects fifteen years of grade inflation, weakened standardized testing, and a federal infrastructure that has been steadily dismantled. Between 2010 and 2022, average high school GPAs rose from 3.02 to 3.32, with the steepest gains in math. State proficiency standards in more than half of the country have been quietly lowered to produce gains that look impressive on paper but don’t reflect actual learning.
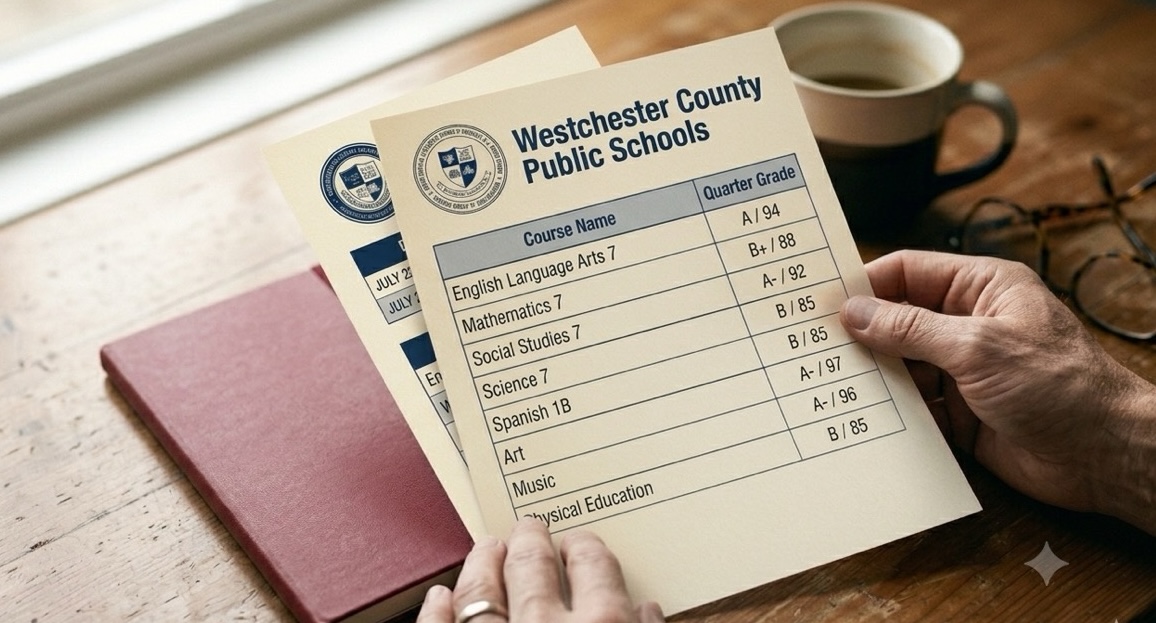
If your child’s final report card just landed (a stack of As and Bs, glowing comments, no red flags), you may have no idea where your child actually stands.
That is the question worth asking this summer.
What does my child’s final report card actually tell me?
A final report card tells you the grade your child earned. That is not the same as how much your child has learned.
What the report card shows and what it hides
A report card shows the final result of a year of work. What it does not show is how the grade was constructed, whether the class itself was rigorous, or whether your child has the foundational skills to handle the next grade level.
Why grade inflation happens
Schools are not entirely to blame for this. Grade inflation is a national phenomenon, and it accelerated meaningfully through the pandemic and the years since.
Teachers facing pressure from multiple directions (administration, parents, students, mental health concerns) often give grades that reflect effort and engagement more than mastery. Schools with high average GPAs look better on rankings, which feeds the cycle.
The Kalil and Rury piece documents this trend across the country.
The Fairfield County and Westchester context
For families in our area, the gap is particularly significant. Local high schools (Greenwich, Darien, Westport, New Canaan, Scarsdale, Rye) all post average GPAs well above the national average. That is partly because the students are academically strong. It is also partly because the grading culture has shifted.
A B+ at one of these schools could mean almost anything.
How can my child have an A and still be behind?
Because grades measure performance against the standards of a specific classroom, and standardized tests measure performance against an independent national benchmark. These two often disagree, and when they do, the test scores are usually the more honest measure.
The Kalil and Rury experiment
A 2025 experiment by the same researchers presented over 2,000 parents with scenarios where a child’s grades and test scores pointed in different directions. The findings were striking. When grades were high but test scores were low, most parents saw no reason to act. In the opposite scenario (low grades, high scores), parents responded with urgency.
On average, parents in the study were willing to pay 14 percent more to fix a drop in grades than to fix a comparable drop in test scores.
Roughly 40 percent of parents said they thought standardized tests were biased. Nearly 30 percent said test scores mostly reflect family income rather than academic ability.
Which one to trust
The pattern is consistent. Parents trust grades. Most distrust standardized tests, or do not understand them well enough to act on what they show.
Here is what the research suggests: when grades and test scores tell different stories, the test scores are typically the better measure of actual learning. Grades are vulnerable to inflation, teacher variation, and classroom context. Standardized scores, for all their limitations, are calibrated against a common standard.
If your child has straight As and tested at the 30th percentile on a state assessment, the 30th percentile is the more accurate signal.
My child’s report card looks fine. Should I still be worried?
Possibly. The student whose grades look fine may be the highest-risk one in the family.
The reason is timing. A student who is genuinely behind but receiving good grades will not get the intervention they need until much later, when the gap has compounded into something harder to fix.
Three patterns worth watching for:
- The coasting student
These students get As in classes where the material is easy or the grading is lenient. They have not built study skills, because they have not had to.
The first time they hit a class that demands real work (often 9th grade Honors, often 11th grade AP), they crash. The grade drops abruptly, and the parents (who saw only As until that point) treat it as a sudden problem rather than a long-standing gap that finally got exposed. - The strong-in-class, weak-on-test student
They participate well, do their homework, write competently on classroom assessments. Their teachers like them.
But on standardized tests (state assessments, ERBs at private schools, the PSAT, the SAT, the ACT), they underperform. This is often a sign that the student has memorized content without building the analytic skills the test measures. - The grade-stable, score-dropping student
Their GPA has been steady for years. Standardized test scores have been quietly dropping in parallel.
The school sees a steady student. Parents see a steady student. The reality is a student who is falling behind grade-level proficiency, slowly, while everyone watches the wrong number.
One specific warning sign
Kalil and Rury offer one specific warning sign worth taking seriously: if your child’s school is one where nearly every student gets an A, treat that as a warning rather than a reassurance. It usually means the grading is no longer producing useful information.
My child’s grades dropped this year. What does the pattern tell me?
A grade drop is information. The pattern of the drop tells you what to do about it.
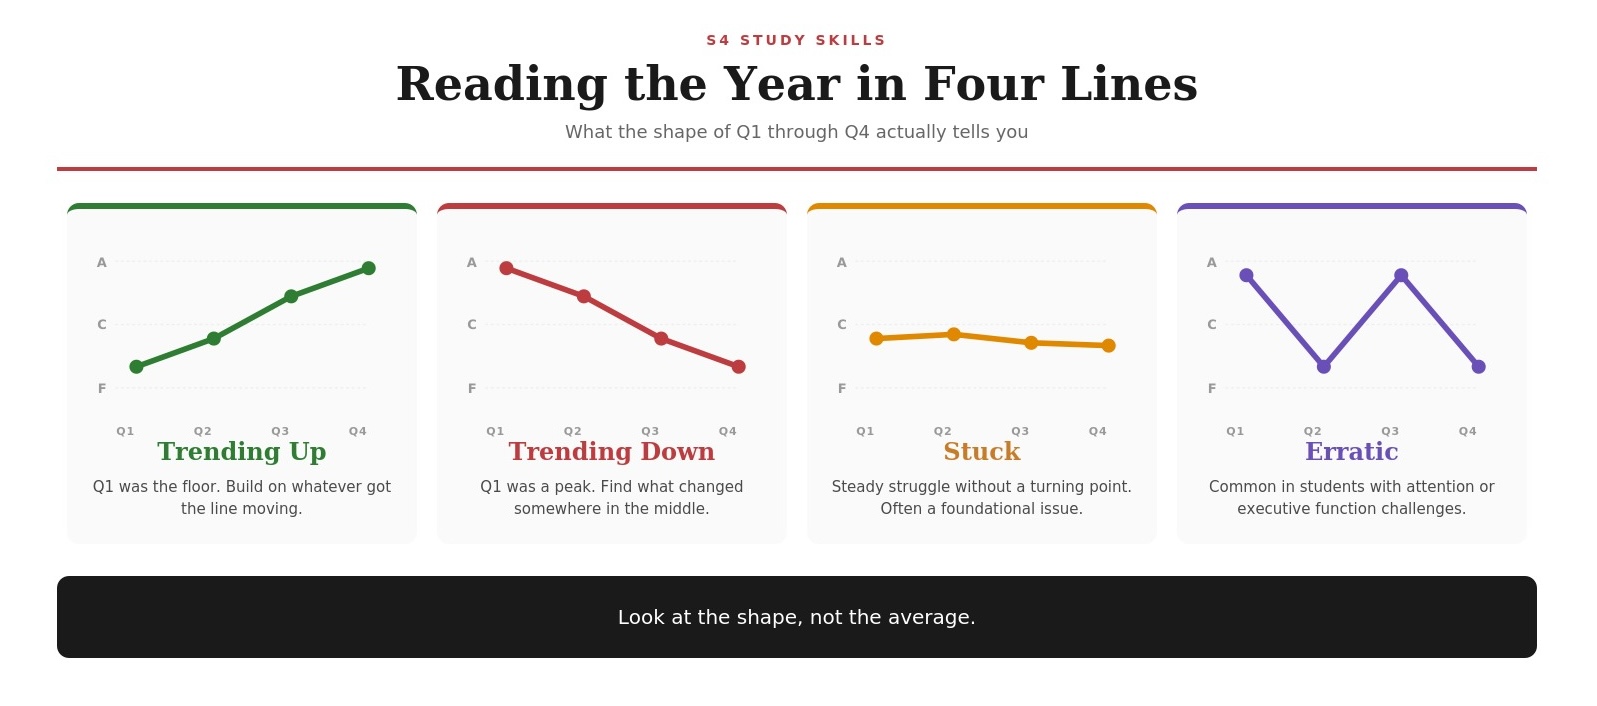
The four patterns:
| Pattern | The signal | What to investigate |
|---|---|---|
| Trending Up (Q1 low, Q4 high) | The recovery story. Your child started behind and built skills. | Identify what worked. Continue it. |
| Trending Down (Q1 high, Q4 low) | The warning sign. Something broke during the year. | A specific class? A social situation? A health issue? A motivation collapse? Different causes require different responses. |
| Stuck (flat low or flat declining) | The chronic gap. The student has been struggling all year without breaking through. | An underlying skill gap, an attention issue, or a mismatch between learning style and instruction. |
| Erratic (alternating high and low) | The consistency problem. The student knows the material when focused but cannot deliver consistently. | Classic signal of executive function challenges or ADHD. |
If the drop happened in math or English specifically, ask the teacher directly what they think the underlying issue is. Teachers usually know. They often do not volunteer the diagnosis because it is uncomfortable to say to a parent in a 15-minute conference.
What other data should I look at besides grades?
Standardized test scores, teacher comments, and (if you can get them) the assignments themselves.
Standardized test scores
If your child takes state assessments, ERBs (most independent schools in our area use these), MAP testing, or has taken the PSAT, SAT, or ACT, those scores are the closest thing to an independent measure of where your child stands.
Request them explicitly. Schools do not always volunteer them. Ask what percentile your child is in and what that percentile actually means.
Teacher comments
Read them carefully. The language teachers use is often more diagnostic than the letter grade. Some common phrases worth decoding:
| What the comment says | What it usually means |
|---|---|
| “A pleasure to have in class” | Shows up, behaves, does average work |
| “Capable of more” | Not trying |
| “Inconsistent” | Executive function or attention issue |
| “Needs to advocate” | Not asking for help when stuck |
| “Has matured” | Was a behavior problem and has improved |
| “Continues to grow” | Still behind, but trying |
The actual work
If you can see your child’s actual assignments (essays, problem sets, projects), look at them with adult eyes. Ask yourself whether the work demonstrates real understanding or surface-level completion.
Many parents have not actually looked at their child’s classroom work since elementary school. The exercise is worth doing.
How do I find out if my child has gaps I should worry about?
A combination of asking the right questions, looking at independent test data, and (if you are not getting clear answers) having an outside evaluation.
Four questions to ask your child’s teachers, directly
- “Is my child working at grade level?” (Not “doing well.” Specifically at grade level.)
- “Are there any skills you would be working on with my child if you had more time?”
- “If my child were in your most rigorous section, would they still get an A?”
- “What would you tell a tutor we hired this summer to focus on?”
These questions tend to produce more useful answers than “How is my child doing?”
If the answers do not match the grades, that is the gap.
When to consider an outside evaluation
For families who want a clearer picture, an academic evaluation (whether through a tutoring organization, a neuropsychologist, or an educational consultant) can provide an independent assessment of where your child actually stands.
This is particularly worth doing if standardized scores have been declining, if grades have been climbing without obvious effort, or if the teacher’s verbal feedback seems softer than the grade suggests.
We do these kinds of evaluations at S4 as part of our intake process. The goal is to give parents a clear picture before deciding what intervention, if any, makes sense.
What should I do this summer if I find a gap?
Summer is the right window to address gaps before they compound into the next school year.
The reason is timing. A gap uncovered in June can be worked on over eight to ten weeks of summer practice. The same gap discovered in October has to be addressed alongside the workload of a new school year, which means it competes with current homework, current tests, and current sleep.
Match the intervention to the gap:
| The gap | The right intervention | What it looks like in practice |
|---|---|---|
| Content-specific (math, writing, science) | Subject matter tutoring | Weekly or biweekly sessions can cover significant ground over the summer |
| Structural (organization, time management, follow-through) | Executive function coaching | A series of sessions where skills build on each other and transfer to every subject |
| Test-taking (SAT, ACT, ERBs) | Targeted test prep | Full-length practice tests, pattern recognition, timing strategies |
| Uncertain | Evaluation first, then intervention | A diagnostic conversation to identify the gap before choosing what to address |
What does not work is hoping the gap resolves on its own. It rarely does. The kids who arrive in September with the same gap they had in June are the ones whose grades will continue to look fine until they don’t.
Our August Essential Study Skills and Executive Function Workshop is also built around exactly this kind of structural gap work. Sessions run online and in Darien across three weeks of August.
Frequently Asked Questions
Why do parents trust grades more than test scores?
Grades arrive more often (every quarter, plus ongoing teacher communications) and are easier to understand than test percentile reports. Standardized test scores come once a year, in formats many parents find confusing.
The Kalil and Rury research found that about 40 percent of parents believe the tests themselves are biased, and about 30 percent think test scores reflect income rather than ability. This trust in grades persists even when grades and test scores disagree.
Has grade inflation gotten worse recently?
Yes. Between 2010 and 2022, average high school GPAs rose from 3.02 to 3.32, with the steepest increases in math. The pandemic accelerated the trend.
Many states have also lowered their proficiency standards on state assessments, which makes proficiency rates look higher without any change in classroom learning. Wisconsin’s English proficiency rate jumped from 39 percent to 48 percent after the state simply redesigned its assessment.
What is the difference between a grade and a proficiency rate?
A grade is given by a teacher and reflects their judgment of the student’s performance in their classroom, against their own standards. A proficiency rate (from a state assessment, NAEP, or similar test) measures whether a student has met grade-level expectations against an independent benchmark. The two often disagree.
What if my child has straight As but I am still worried?
Take the worry seriously. Parents are often right when they sense a gap, and they often dismiss the worry because the grades look fine. If your instinct is telling you something is off, request the standardized test scores, ask your child’s teacher direct questions about grade-level proficiency, and consider an outside evaluation.
What is a benchmark assessment?
Benchmark assessments like MAP (Measures of Academic Progress) are tests given two to three times a year to measure where a student stands relative to grade-level expectations. Many public and independent schools use them. Most parents have never seen their child’s MAP results unless they ask. The scores are usually available on request.
How do I know if my child needs a tutor or a coach?
A tutor is usually appropriate when there is a specific subject gap, a skill that needs to be rebuilt, or a learning issue that needs targeted support. An executive function coach is more useful when the issue is structural: organization, time management, follow-through, self-advocacy. Many students benefit from one. Some benefit from both. A diagnostic conversation can help you figure out which fits.
Your child’s report card is one piece of information. Standardized test scores are another. Teacher comments are a third. The actual work your child has produced this year is a fourth.
If you put all four together and the picture is consistent, you can trust it.
When they tell different stories, take the tougher version seriously.
The students who arrive in September with their gaps named and being worked on have a different school year ahead of them than the students who do not.
NOT SURE WHERE YOUR CHILD STANDS?Call us at 203-307-5455 for a 30-minute diagnostic conversation. We will help you decide what (if anything) needs intervention this summer. We work with families across Fairfield County and Westchester, both in person and remotely. |

